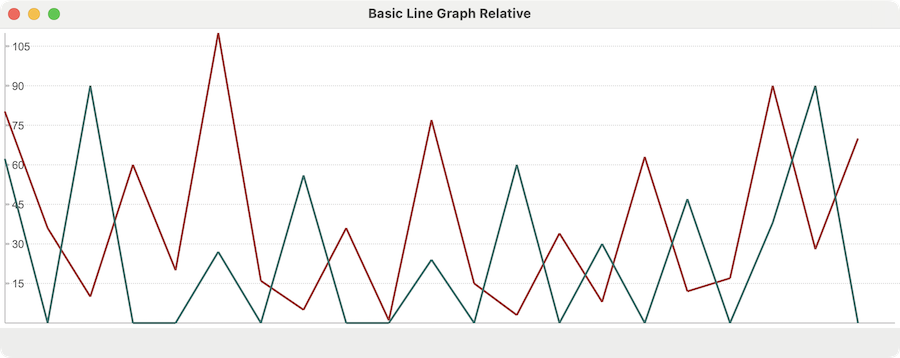
Graphs and Charts is a new library for Glimmer DSL for LibUI (Prerequisite-Free Ruby Desktop Development Cross-Platform Native GUI Library) that aims at providing Custom Controls for rendering graphs and charts. In version 0.1.1, it supports Line Graph in a new `line_graph` Custom Control for rendering lines (1 or more) connecting points with different y-axis values along a time-based x-axis.
This file contains hidden or bidirectional Unicode text that may be interpreted or compiled differently than what appears below. To review, open the file in an editor that reveals hidden Unicode characters.
Learn more about bidirectional Unicode characters
# Source: https://github.com/AndyObtiva/glimmer-libui-cc-graphs_and_charts | |
require 'glimmer-dsl-libui' | |
require 'glimmer/view/line_graph' | |
class BasicLineGraph | |
include Glimmer::LibUI::Application | |
before_body do | |
@start_time = Time.now | |
end | |
body { | |
window('Basic Line Graph', 900, 330) { | |
line_graph( | |
width: 900, | |
height: 300, | |
graph_point_distance: :width_divided_by_point_count, | |
lines: [ | |
{ | |
name: 'Feature A', | |
stroke: [163, 40, 39, thickness: 2], | |
x_value_start: @start_time, | |
x_interval_in_seconds: 8, | |
x_value_format: -> (time) {time.strftime("%a %d %b %Y %T GMT")}, | |
y_values: [80, 36, 10, 60, 20, 110, 16, 5, 36, 1, 77, 15, 3, 34, 8, 63, 12, 17, 90, 28, 70] | |
}, | |
{ | |
name: 'Feature B', | |
stroke: [47, 109, 104, thickness: 2], | |
x_value_start: @start_time, | |
x_interval_in_seconds: 8, | |
x_value_format: -> (time) {time.strftime("%a %d %b %Y %T GMT")}, | |
y_values: [62, 0, 90, 0, 0, 27, 0, 56, 0, 0, 24, 0, 60, 0, 30, 0, 47, 0, 38, 90, 0] | |
}, | |
], | |
display_attributes_on_hover: true, | |
) | |
} | |
} | |
end | |
BasicLineGraph.launch |
Happy Glimmering!
No comments:
Post a Comment